Let me bore you to tears with coin flip analogies
in Probability R
January 7, 2025
Even the word “probability” is enough to make most people yawn and often when it’s taught it’s usually through tedious coin flips with no bigger picture painted as to why it’s even helpful in the first place. Let’s try to change that.
What’s your hot take?
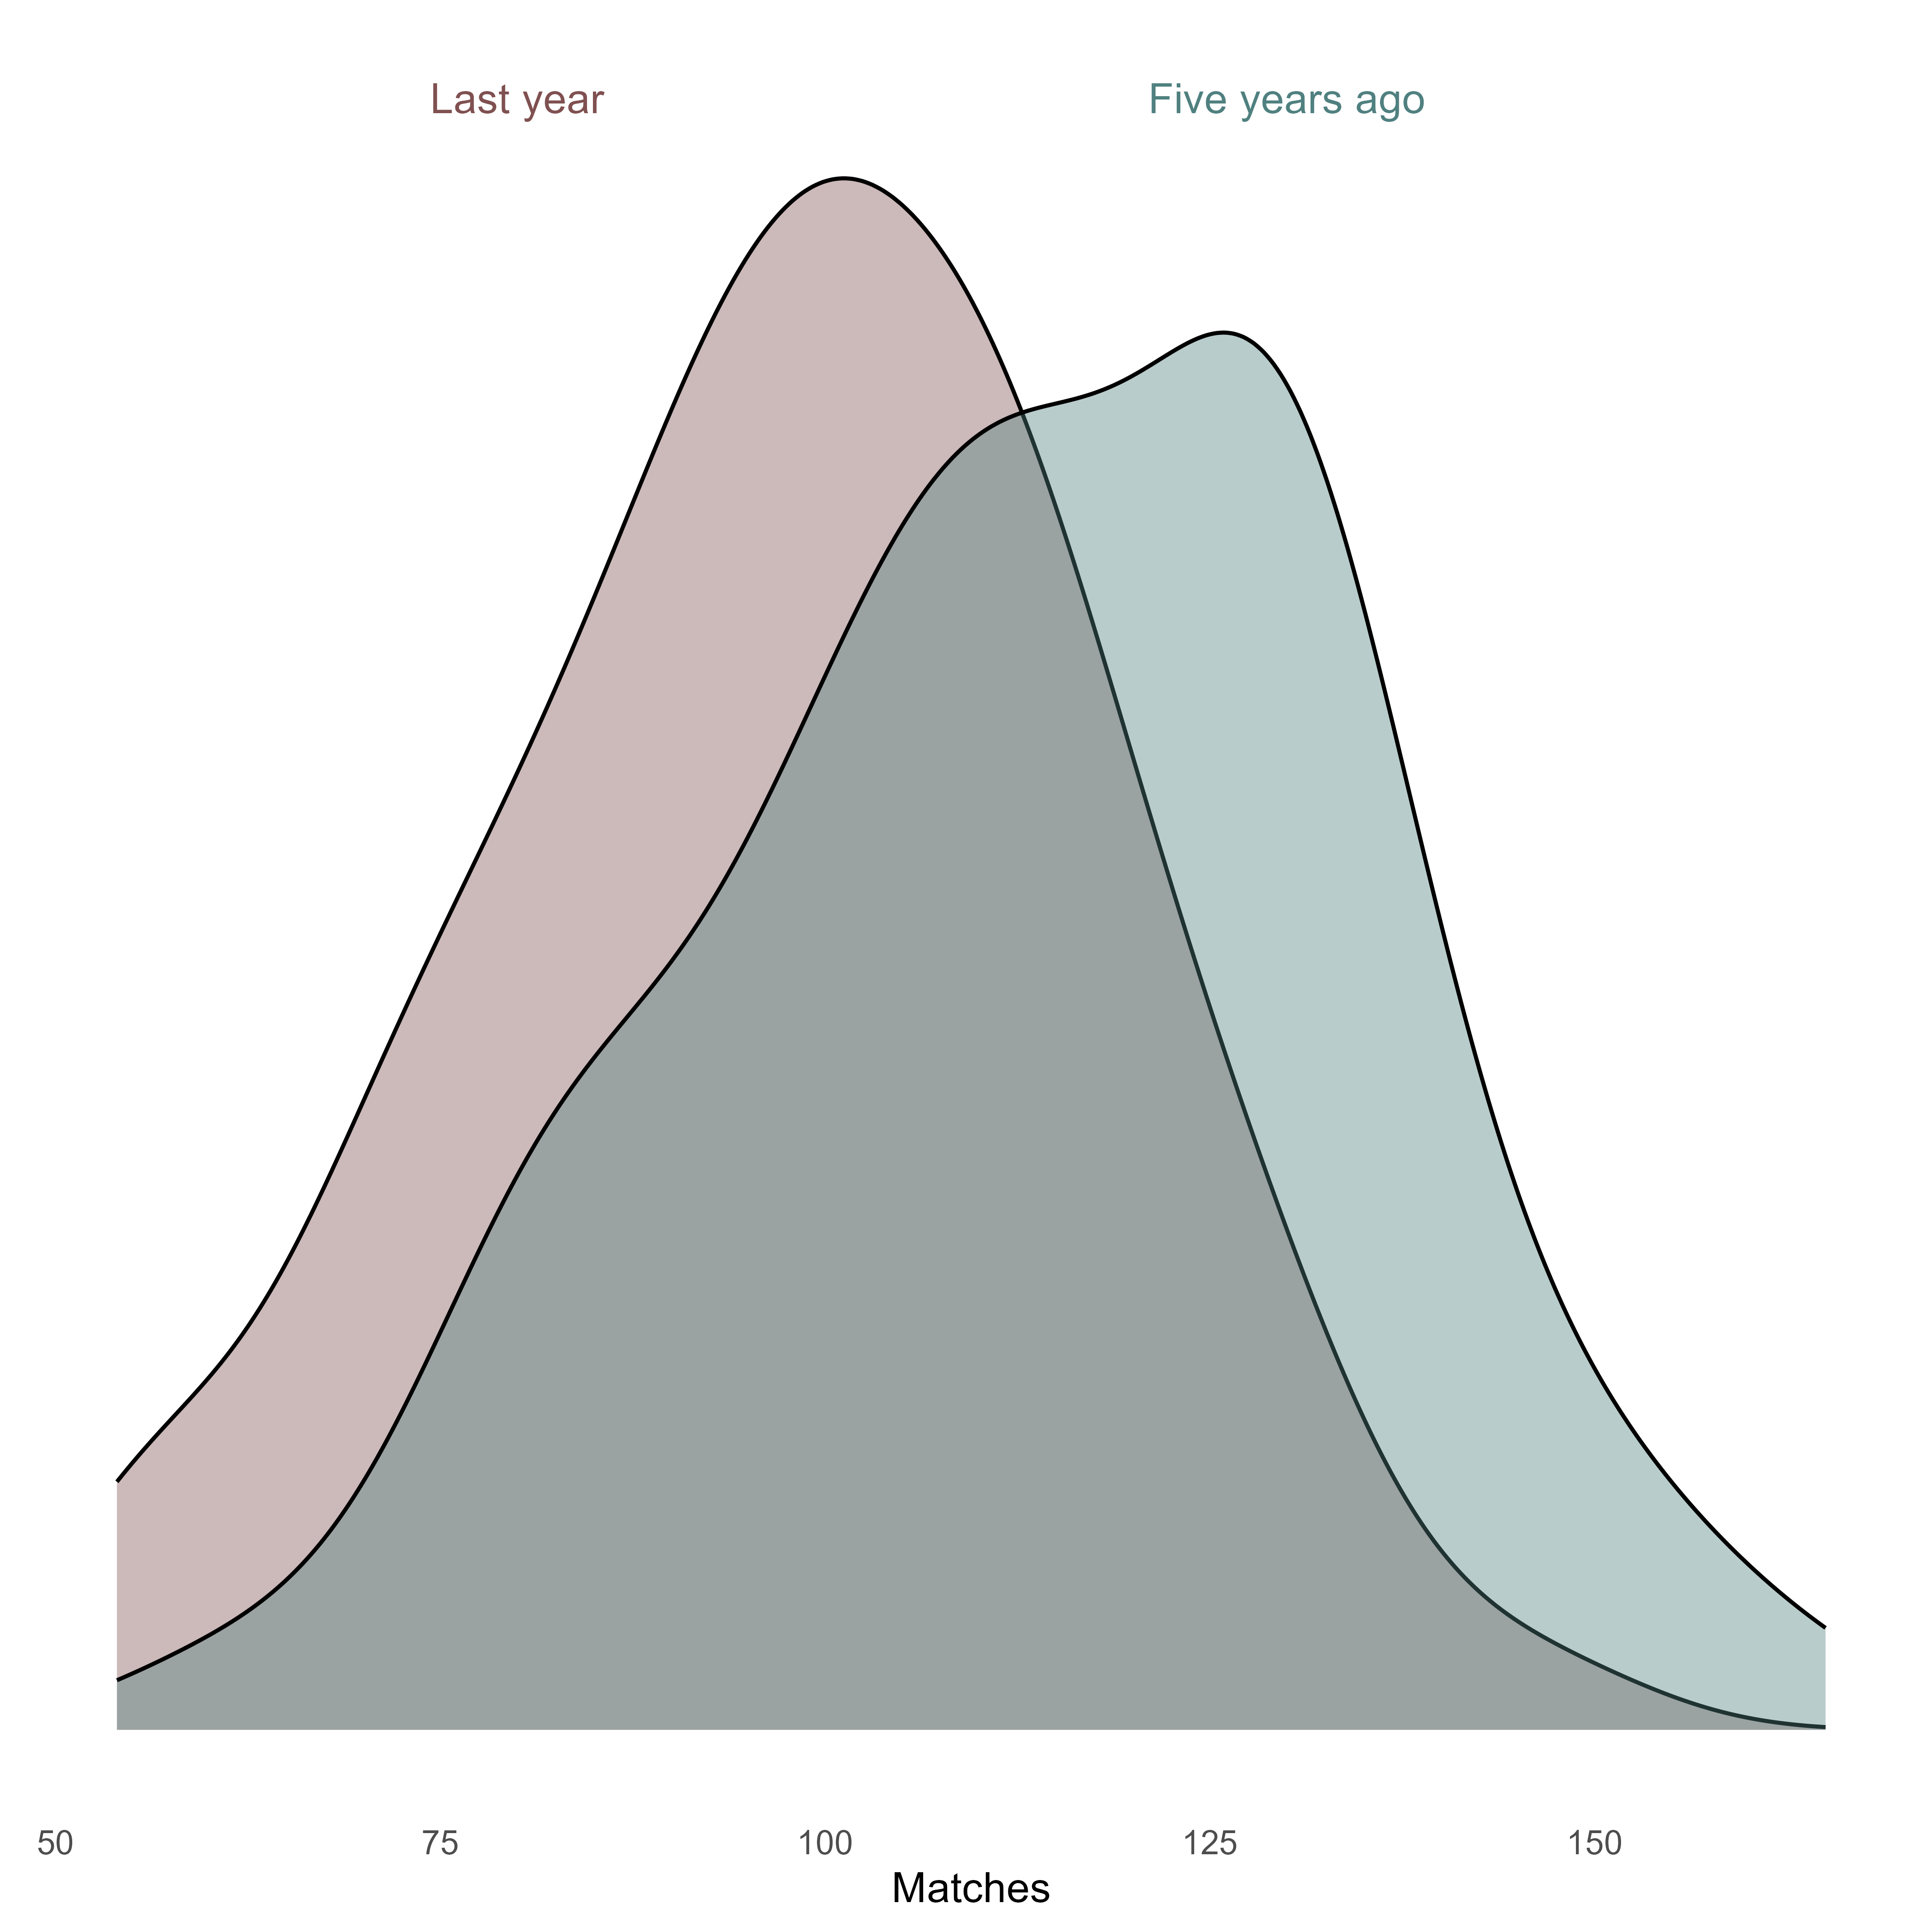
So let’s start with some intuition; what is a hot-take that you have that you could actually collect data on? For example, it seems like more and more of my friends are getting fewer and fewer matches on dating apps compared to five years ago. This could be for many reasons - maybe there are just fewer people on these apps now in general? Maybe people are becoming more and more picky with who they’ll swipe? Maybe we’ve all got uglier…
Either way, we can get an answer to this by asking every dating app user how many matches they got in a single year five years ago and how many they got over the whole of last year. This would answer our question but we’d have to ask millions of people which would clearly be a nightmare. So we might instead opt to collect a sample of data from say 100 randomly selected people that we think represents those millions of people to save us the time and dolla. Here’s what the first 10 people might have told us:
| Person | Five years ago | Last year |
|---|---|---|
| 1 | 81 | 78 |
| 2 | 118 | 73 |
| 3 | 115 | 80 |
| 4 | 121 | 92 |
| 5 | 81 | 92 |
| 6 | 94 | 108 |
| 7 | 113 | 114 |
| 8 | 129 | 140 |
| 9 | 105 | 113 |
| 10 | 125 | 91 |
One of the people in our sample above, Oliver Klosoff (person 6), might tell us triumphantly that he received 108 matches last year compared to 94 five years ago. Whereas, Anita Bath (person 2) might be gutted to reveal she only got 73 matches last year compared to 118 five years ago. So you’ll see the number we’re interested in is really the difference in matches for each person:
| Person | Five years ago | Last year | Difference |
|---|---|---|---|
| 1 | 81 | 78 | -3 |
| 2 | 118 | 73 | -45 |
| 3 | 115 | 80 | -35 |
| 4 | 121 | 92 | -29 |
| 5 | 81 | 92 | 11 |
| 6 | 94 | 108 | 14 |
| 7 | 113 | 114 | 1 |
| 8 | 129 | 140 | 11 |
| 9 | 105 | 113 | 8 |
| 10 | 125 | 91 | -34 |
So whilst some people have got more and some fewer matches than five years ago, we might even see a pattern when we zoom out and look at the average difference for everyone we asked which shows a drop of 15.78 matches for your average Joe! Now here some might call it a day and write up their daily mail headline “FALLING OUT OF LOVE WITH DATING APPS? NEW FIGURES TELL OF DATING APP DOOM”.
Buuuuut remember we only asked 100 people and not the millions we want to make this claim about, so how legit is this difference beyond the small sample of people we asked? Do we believe what we saw truly reflects what’s going on for the millions of people using the app? Maybe just by chance we included loads of Anita’s or too few Oliver’s which made our sample look very different to the reality. This is just part of the random fluctuation that ripples through all of our daily lives that leads us to think something is there when there really might not be. So how can we check?
Picture an alternate reality
My hot-take was that people had fewer matches now than they did five years ago i.e. the difference is negative for your average Joe. But what’s the alternative reality? It’s a world where this hot-take doesn’t hold water, so your average Joe in fact tells us there is no difference in matches or he’s been killing it and has even more than five years prior.
We’d then be asking ourselves “okay, if we’re living in that alternative reality, what are the chances of seeing this drop of 15.78 matches or worse for your average Joe like we just saw in our sample?”. Instinctually, this seems pretty unlikely right? If people have had a glow-up since five years ago and are now killing it on these apps getting loads and loads of matches, then the chances of us seeing a drop in matches like this would be pretty slim.
Using information from our sample we can essentially plug that question into the stats machine and it will give us an answer to this. By the way, you should have a think about what “rare” means to you and agree on this before anything goes into the stats machine. Controversially, stats nerds historically agreed that only something that occurred 5% of the time was worth getting out of bed for. You might disagree but let’s roll with it here.
If our stats machine spat out a 0.0001% chance we’d think “wow that’s so rare to see what we just saw from our data…a lot rarer than 5%. This drop of 15.78 matches feels less like a coincidence then”. This makes our alternative reality less convincing because of how unlikely it was to see the results we just witnessed. So much so that we can reject it and say actually the reality is people do have fewer matches now based on our chances being rarer than 5%!
Now if the chances spat out were 50%, we might think “okay, it seems likely we could easily see a drop like 15.78 matches in our alternative reality, it’s 50/50 so not exactly rare”. So this means we can’t reject it this time because a decrease like the one we saw could easily happen in that world; it’s a lot more common than our 5%.
In this case, when we plugged the info of our 100 people into the stats machine, we actually got a 0.000008% chance of seeing this 15.78 drop in matches or worse in our alternate reality. So, again, that’s not to say we would never see it happen just that it would be very rare in that alternate reality where people now have more matches than they know what to do with. This is a lot rarer than the 5% we had agreed on before we started asking people so we can reject the alternate reality and say there has actually been a decrease in matches (although unfortunately we’re no closer to knowing if it’s because we’re all uglier…). Now you can write your headline.
The stats machine
For those of you thirsty for more, desperate to know what that stats machine does; here is what’s in the soup…
We can get some helpful information that summarises all of those differences in matches we calculated earlier. One of those is the average difference which we already heard was a drop of 15.78 matches. But as we also saw in our table of answers from people, some actually did have MORE matches than before so this gives us an indication that not everybody’s experience fits this pattern so there must be variation around this. It might be helpful to know how spread out these differences are - so we could work out, on average, how far off the drop of 15.78 matches people in our sample are. It turns out this is 27.99 matches on either side of -15.78 which is a pretty wide spread (this would mean typically most of the people in our sample had experienced a change of -43.77 to +12.21 matches.
We had 100 people in our sample and as we covered earlier, none of this stats business would be needed if we could get the answers from all of the millions of people that use dating apps. As we recruit more and more people from 100 to 10,000 then to 100,000 we would expect to trust our results more and more as we get closer to asking everyone ever.
We wrap up our -15.78 (the average difference in matches), 27.99 (the average variation in matches) and 100 (the number of people we asked) into a nice simple value. We can compare this value to values that follow pre-defined rules from natural patterns that occur in the world around us. This allows us to see the chances of witnessing a drop of 15.78 matches (or worse) if we were living in our alternate reality which is what we found above. Voilà !